Keep 0 on axis for the positive and negative
- DataZoe

- Oct 30, 2020
- 1 min read
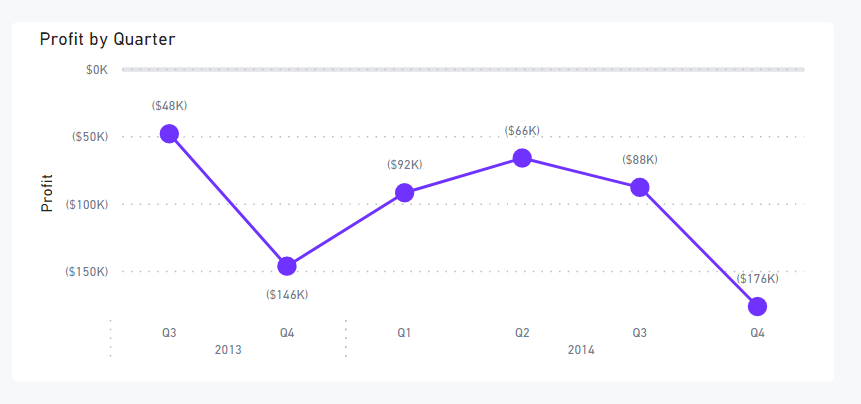
I want to keep the 0 always on the y-axis in a line chart with a measure that could be positive or negative. I could simply make the minimum 0 but then negative values would not be visible. What to do? To solve this, I include a constant line that = 0!
I format this constant line a mute color, like light grey, so it's visible but not distracting, or sometimes I just make it transparent. Not visible but keeping 0 as the min or max depending on the way the line goes.


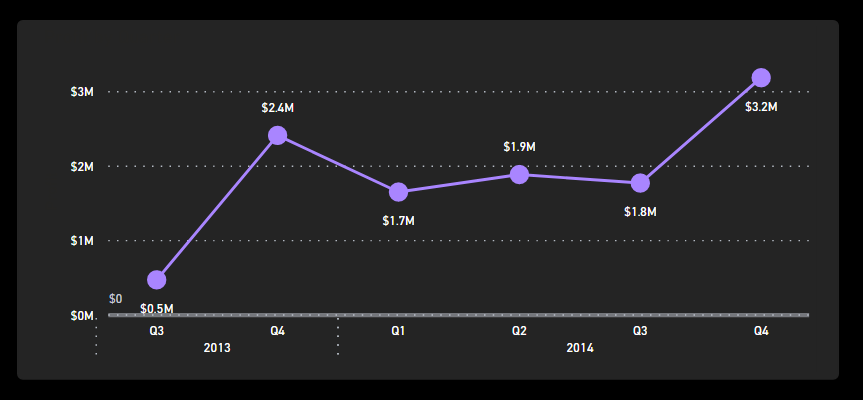


This keeps the 0 there, no matter how the line goes, which was the desired outcome.
In another tip I will go over how to highlight that line for certain outcomes, such as negative or min/max.


Comments